
How to Choose Advanced Data Grid Filters for E-commerce and Project Management
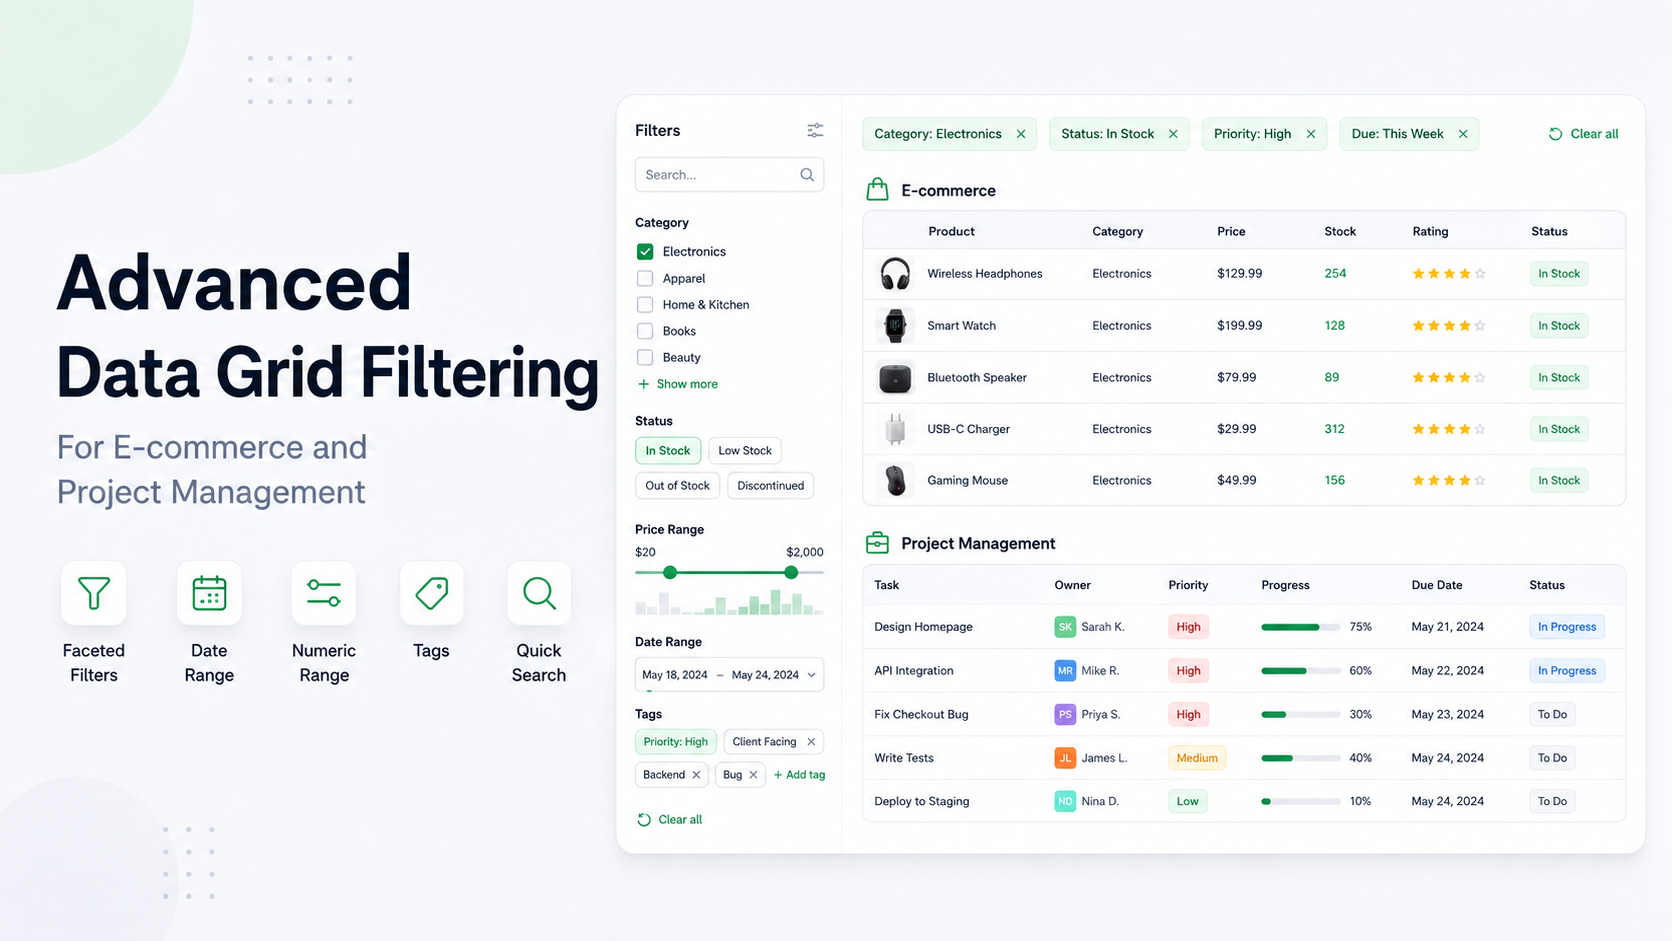
Filtering is where a data grid becomes a working product rather than a passive table. A support agent needs open orders in one region. A merchandiser needs low-stock products from selected suppliers. A portfolio manager needs delayed projects above a risk threshold.
The right control depends on the question, not on how many choices fit in a menu. RevoGrid Core filtering covers direct conditions; RevoGrid Pro adds controls that reveal available values, distributions, date context, and reusable views. See every control running in the Advanced Filtering showcase.
Quick answer: Use a Core condition when the user knows the value or cutoff. Use a visual or structured filter when they need to explore a vocabulary, distribution, date range, or tag set. Let the server evaluate the filter when the browser does not hold the complete dataset.
How to use this guide
Each image below is the filter itself—not a full grid example. Start with the smallest control that accurately expresses the question, then add richer controls only where they remove real interpretation work.
| Question | Good starting point |
|---|---|
| “I know the word, code, or cutoff.” | Text or Number |
| “I need to choose from known values.” | Selection, Faceted List, or Excel-style Selection |
| “I need to explore a range or distribution.” | Slider, Histogram Brush, or Statistical Presets |
| “I need calendar, time-zone, or recurring-time context.” | Date, Datetime, Calendar Range, Relative Window, Timeline Brush, or Time Matrix |
| “The cell contains several labels.” | Array or Array/Tags |
Common filter controls
These controls cover the standard column data shapes and familiar product workflows.
Text
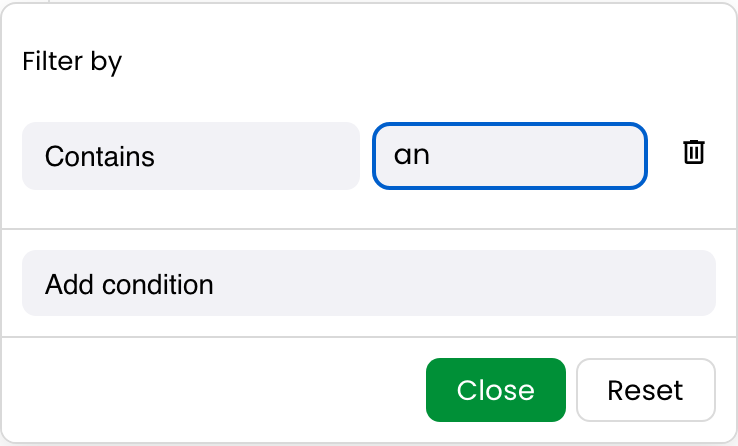
Use it when: users know a word, exact identifier, prefix, or missing-value rule. It supports direct conditions such as contains, equals, begins with, and blank checks.
Example: find customer names containing an or SKUs beginning with EU-. Choose Fuzzy Search when spelling is uncertain, or Regular Expression for an expert-defined pattern.
Number
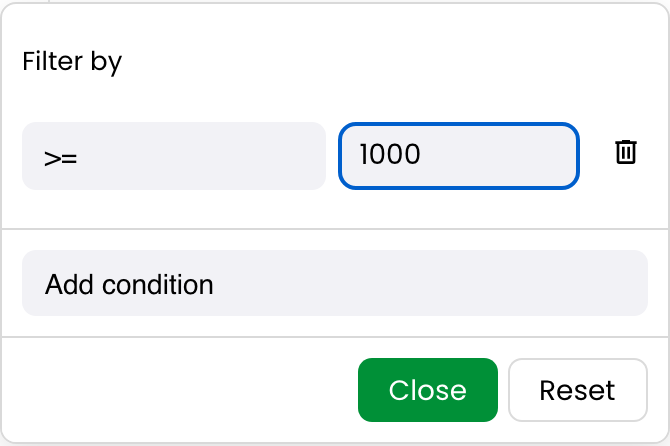
Use it when: a known policy threshold is the question—such as stock below 10, margin above zero, or an order total of at least €1,000.
Example: make a high-value order queue with ≥ 1000. Choose a Slider to explore a range, a Histogram Brush to see its distribution, or Statistical Presets for relative questions such as “top 10%.”
Selection
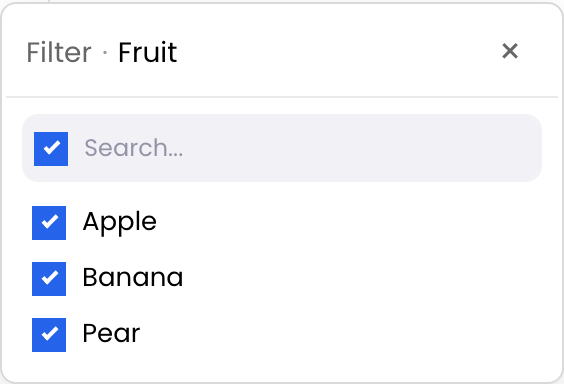
Use it when: users should select from a known, manageable vocabulary such as region, status, owner, or category.
Example: remove Discontinued and Out of stock products from a catalog view. Choose a Faceted List when value counts help users understand the result, or Excel-style Selection when edits must be staged before applying.
Excel-style Selection
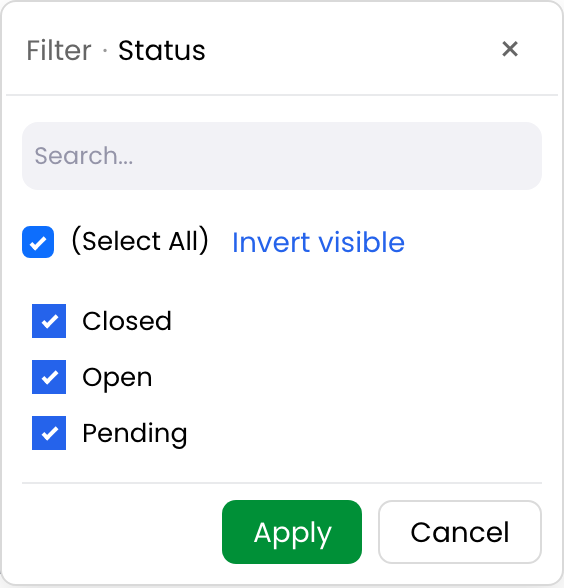
Use it when: spreadsheet-oriented users need to review several choices before changing a financially or operationally important result set.
Example: a finance analyst selects legal entities and reporting periods, then presses Apply once. Choose ordinary Selection for immediate lightweight filtering; the Excel-style version deliberately stages changes and provides Apply and Cancel.
Selection Cascade
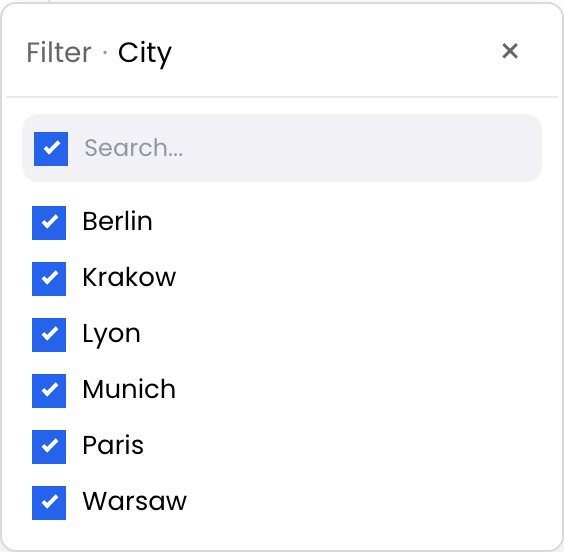
Use it when: one filter’s choices depend on other active columns.
Example: after filtering Country to Germany, show only the applicable cities. Choose ordinary Selection when every option should always remain available; Cascade prevents impossible category/product, country/city, and portfolio/project combinations.
Slider
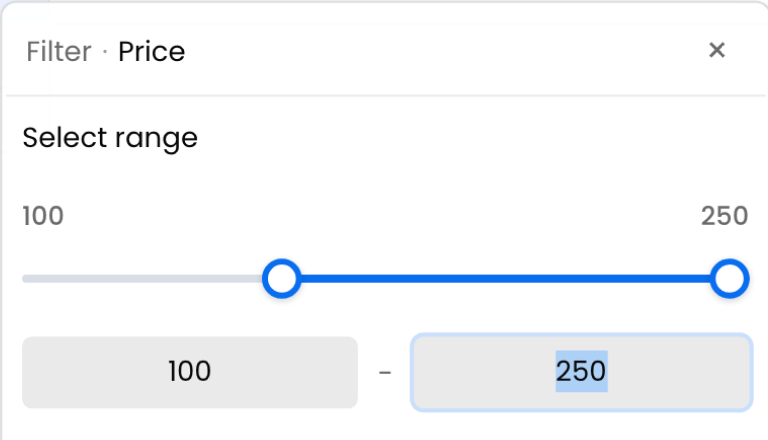
Use it when: users think in an inclusive numeric interval but do not begin with exact typed bounds.
Example: set a price range for products between €50 and €150. Choose Number when the cutoff is already known; choose Histogram Brush when the user needs to see clusters and outliers before setting the bounds.
Date
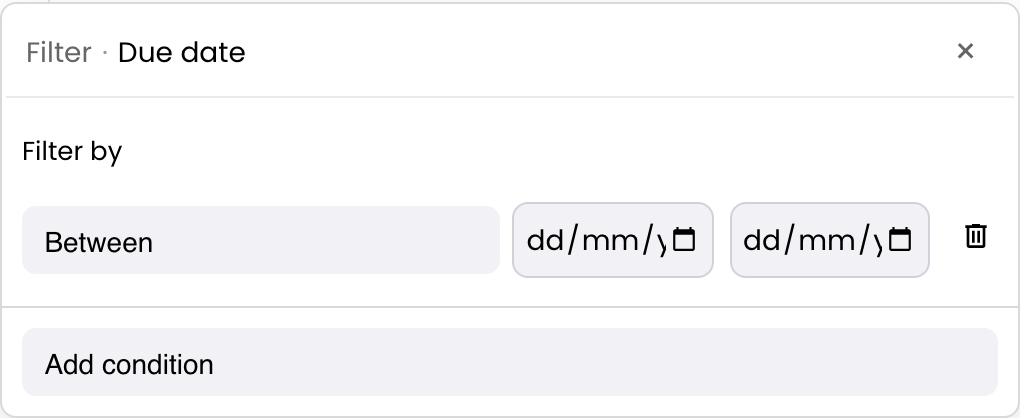
Use it when: the data represents civil calendar days such as order date, due date, or accounting date.
Example: show deliveries due between two reporting dates. Choose Datetime for exact instants and an explicit time-zone policy; choose Calendar Range when a visual calendar is the preferred interaction.
Datetime
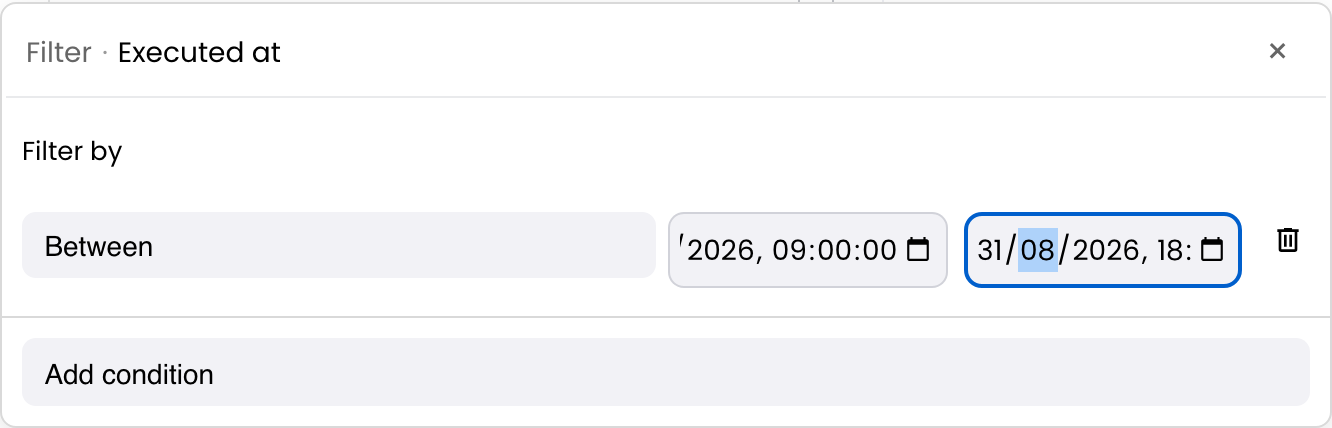
Use it when: a timestamp’s time and timezone matter—for audit events, deployment incidents, or exact SLA cutoffs.
Example: isolate orders created between two UTC instants. Choose Date for date-only business fields, or Timeline Brush when density and bursts in time are part of the decision.
Boolean
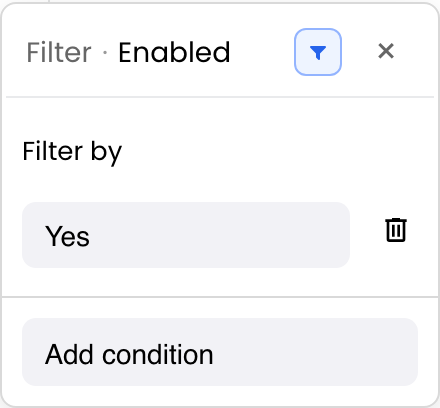
Use it when: the source field has strict Yes/No meaning, such as approved, expedited, or billable.
Example: show only expedited orders. Choose Tri-state Boolean when users also need an explicit All state and control over how blanks are treated.
Array
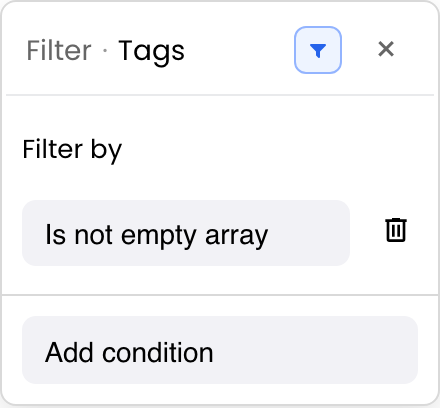
Use it when: the immediate question is whether a cell has an empty or non-empty list.
Example: find projects with no assigned skills or products with no campaign labels. Choose Array/Tags when users need membership logic such as “has any,” “has all,” or “has none.”
Quick Filter

Use it when: users know fragments but not which visible column contains them.
Example: search Lisbon pending across customer, city, and status before refining the order queue. Choose a column filter when the field and matching rule must be explicit; Quick Filter is a broad first pass, not a substitute for saved business rules.
Choosing among common controls
Selection is the quick, live checklist. Faceted List adds evidence through all-row and visible-row counts. Excel-style Selection adds a safer staged commit. For numbers, a direct condition is best for a known cutoff, a Slider is best for an exploratory range, and a Histogram Brush is best when the distribution changes the decision. Date is for calendar days; Datetime is for instants; the structured temporal controls below choose the interaction around those same concepts.
Structured filter controls
RevoGrid Pro structured filters give a column an interaction matched to its data shape while continuing to use the same filter state and lifecycle.
Token List
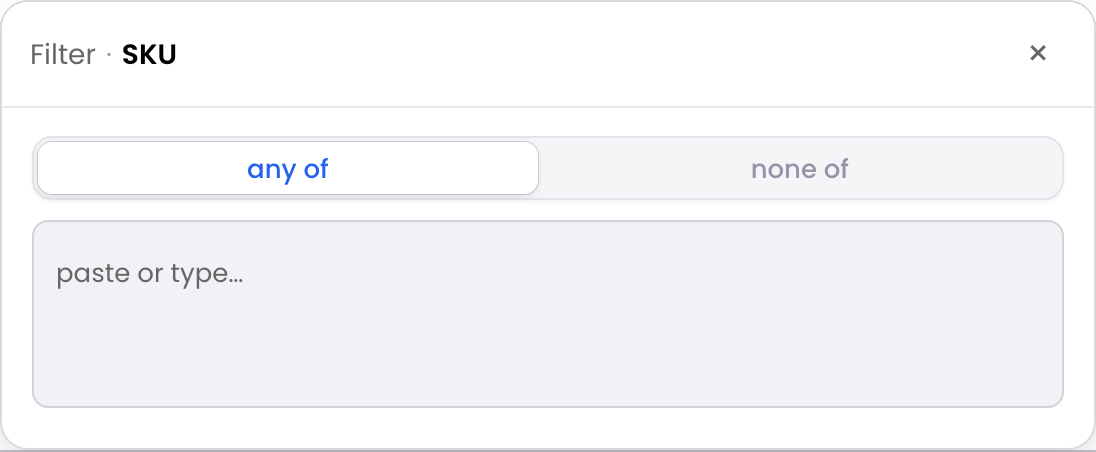
Use it when: the user already has several exact values, often copied from another system.
Example: paste a payment-exception report’s order IDs or a supplier’s SKU list. Choose Text when there is one value or a fragment; Token List avoids repeated manual searches for a known worklist.
Fuzzy Search
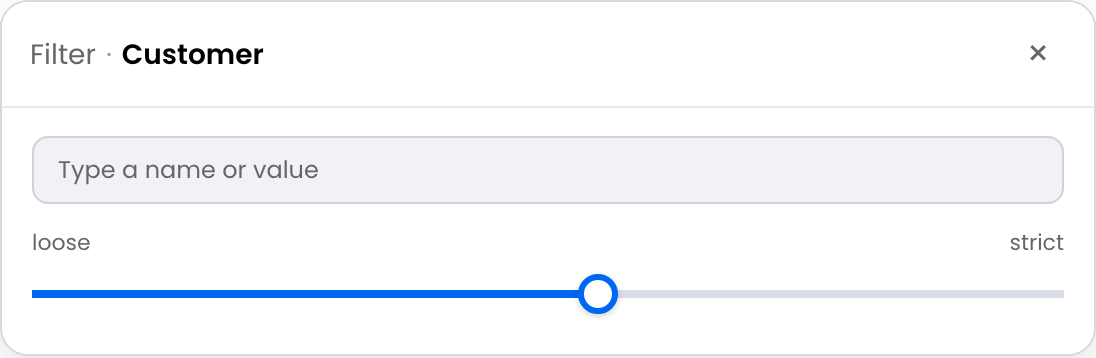
Use it when: human-entered names, companies, or product titles may contain typos or small variations.
Example: search Jon Smth and still find John Smith. Choose Text for literal matching or Regular Expression for a controlled technical pattern; Fuzzy Search is intentionally forgiving.
Regular Expression
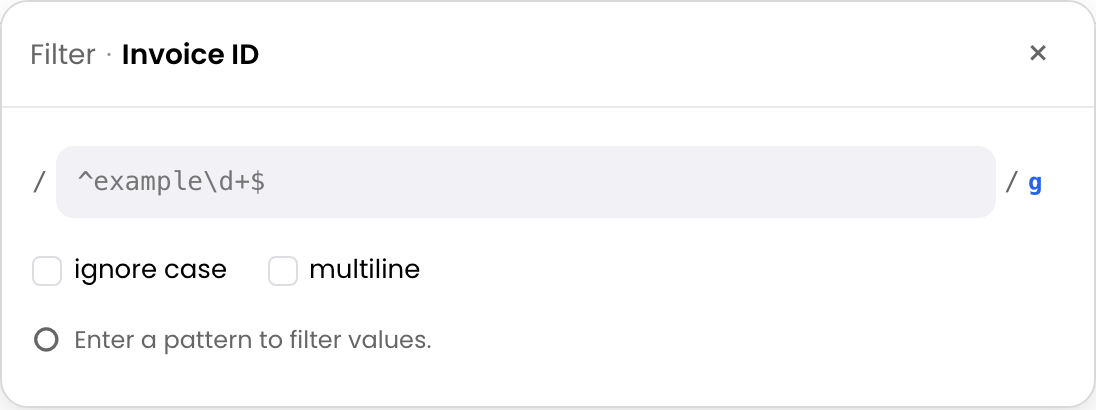
Use it when: expert users need a repeatable identifier, domain, prefix, or formatting rule.
Example: audit invoice IDs that should match ^INV-\d{6}$. Choose Text for a literal fragment; regular expressions are powerful but should be reserved for users who understand the pattern.
Faceted List
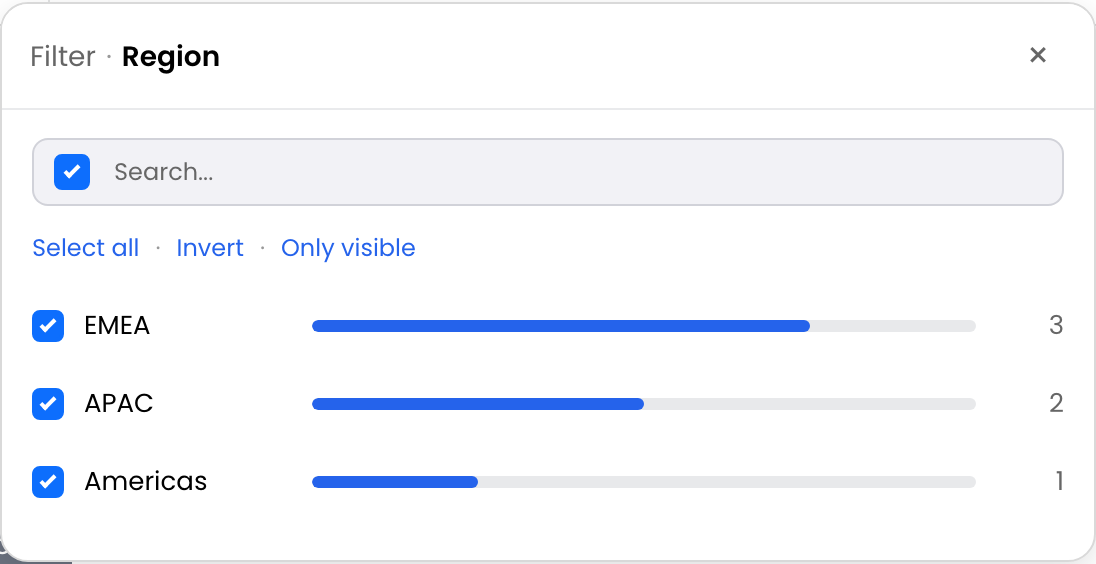
Use it when: users need to see which values exist and how much each choice will affect the result.
Example: compare the remaining order counts for EMEA, APAC, and Americas after another filter is active. Choose Selection when counts add no decision value; Faceted List is the better exploratory checklist.
Chip and Badge Toggles
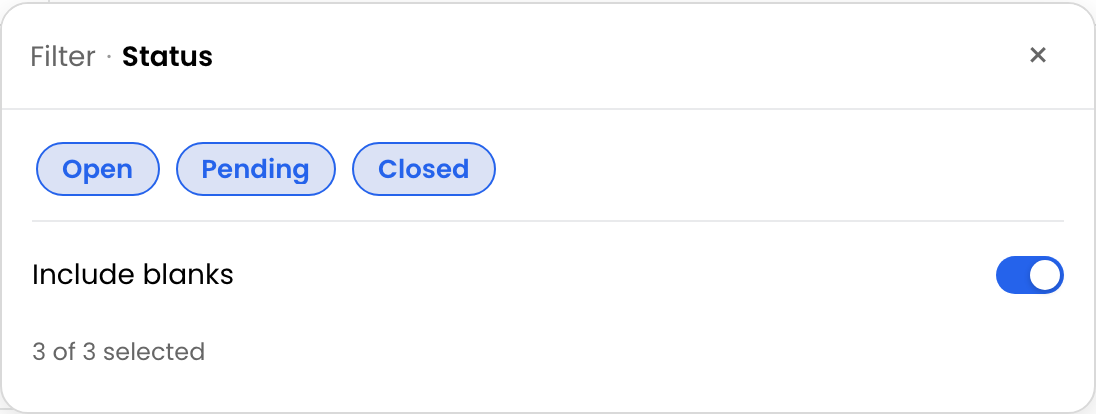
Use it when: a small, stable set of statuses is recognized faster by a visual pill than by text.
Example: toggle Open, Blocked, and At risk project health. Choose Faceted List for a longer or changing vocabulary; chips should not become a wall of options.
Histogram Brush
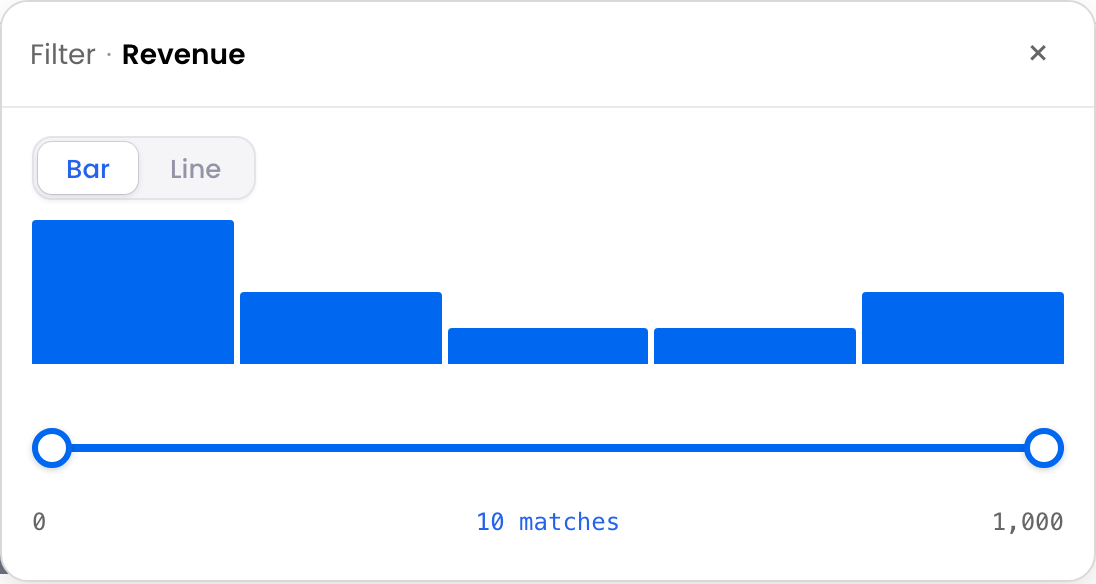
Use it when: the shape of numeric data matters before choosing an interval.
Example: brush the dense €50–€150 product-price band, while seeing sparse outliers. Choose Slider for a clean range without analysis; Histogram Brush earns its space when distribution context changes the choice.
Rating or Progress Threshold
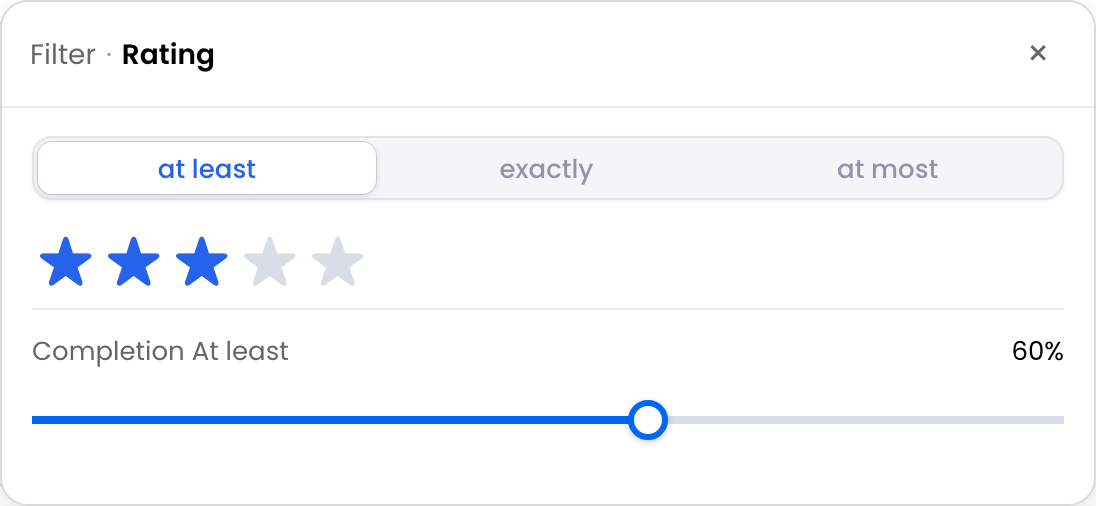
Use it when: a bounded scale—stars, percent complete, confidence, or health score—has a natural at-least or at-most question.
Example: show products rated at least four stars or projects no more than 60% complete. Choose Number for unbounded measures such as revenue; the threshold control makes a familiar scale easier to read.
Statistical Presets
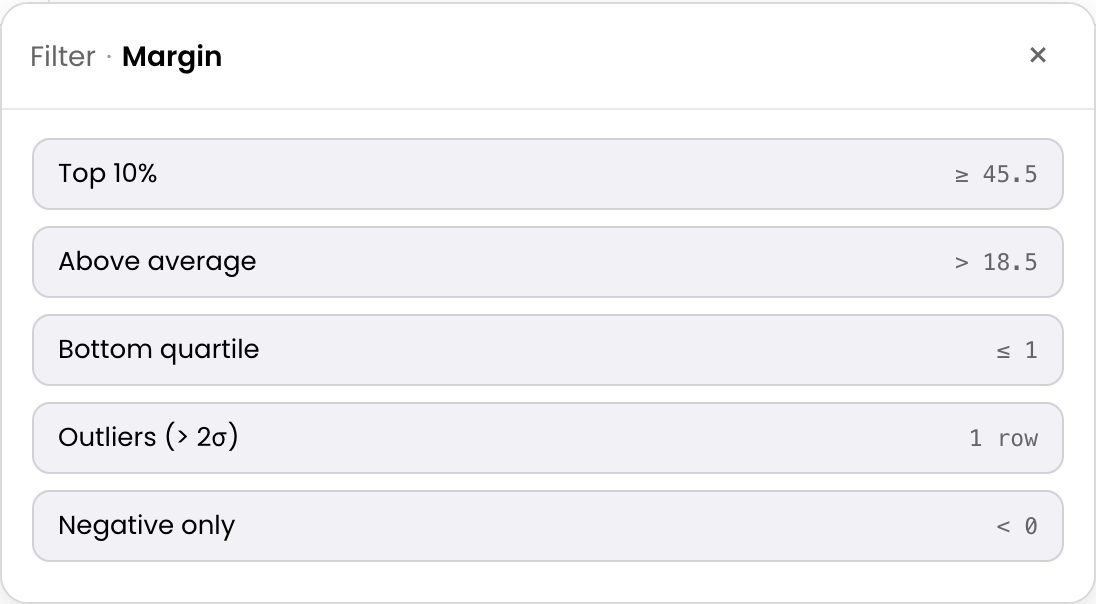
Use it when: the question is relative to the current dataset rather than a fixed policy cutoff.
Example: show the bottom-quartile projects by delivery health or the top 10% of orders by total. Choose Number or Slider for an absolute range; Statistical Presets answer “top,” “average,” and “outlier” without manual calculation.
Calendar Range
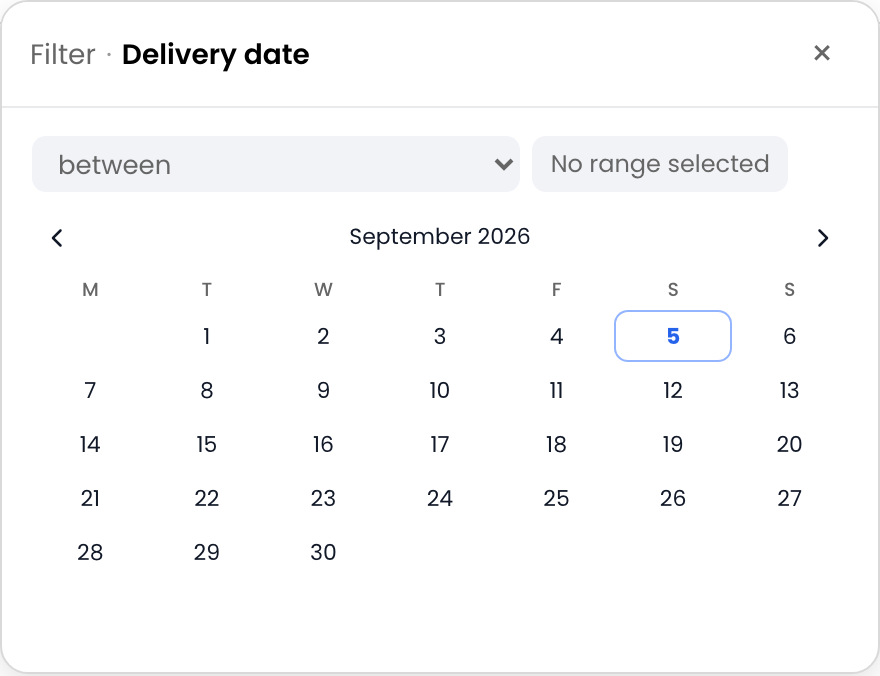
Use it when: users think in calendar days and should choose a fixed inclusive period visually.
Example: select all orders delivered in September. Choose Date when typing or selecting a condition is faster, and Relative Window when the view should move automatically with today.
Relative Window
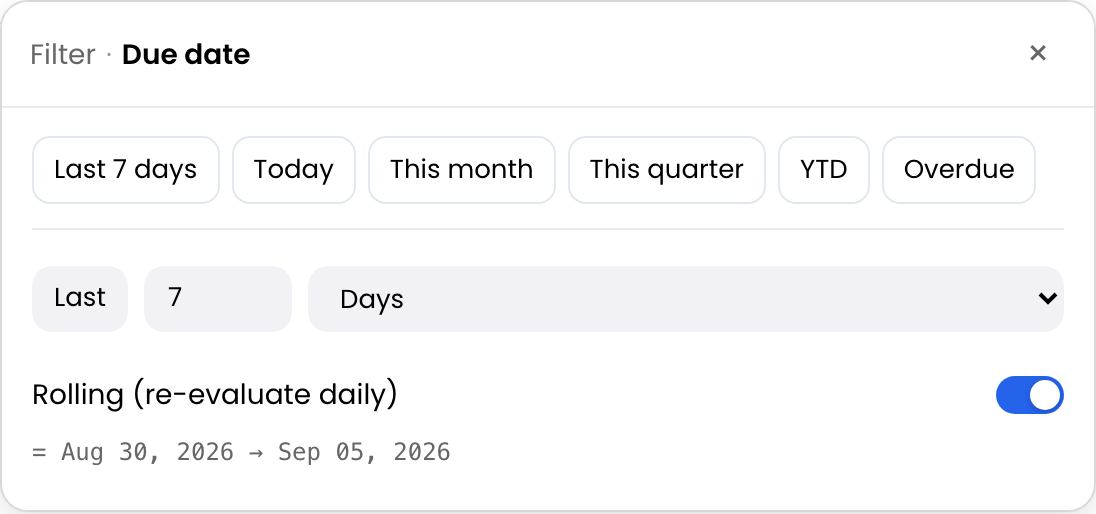
Use it when: a saved view should remain current without editing its dates every day or month.
Example: keep a support queue scoped to tickets opened in the last seven days. Choose Calendar Range for a fixed historical report; Relative Window is for rolling and calendar-relative periods.
Timeline Brush
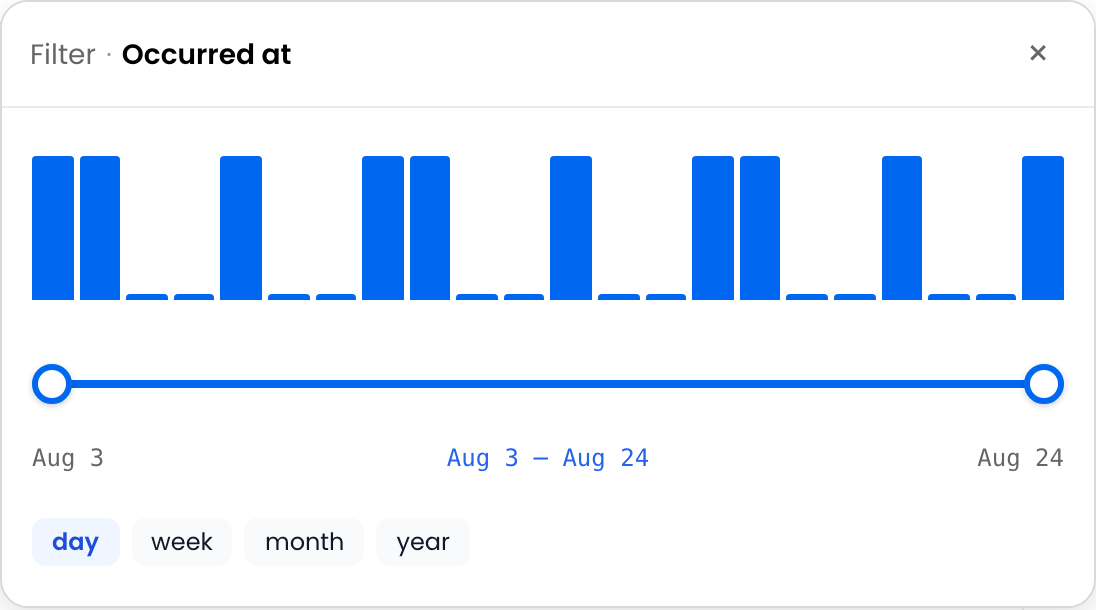
Use it when: timing density, gaps, bursts, or a deployment window matters as much as the endpoints.
Example: isolate the cluster of incidents immediately after a release. Choose Datetime for precise typed instants or Calendar Range for date-only reporting; Timeline Brush makes temporal patterns visible.
Time Matrix
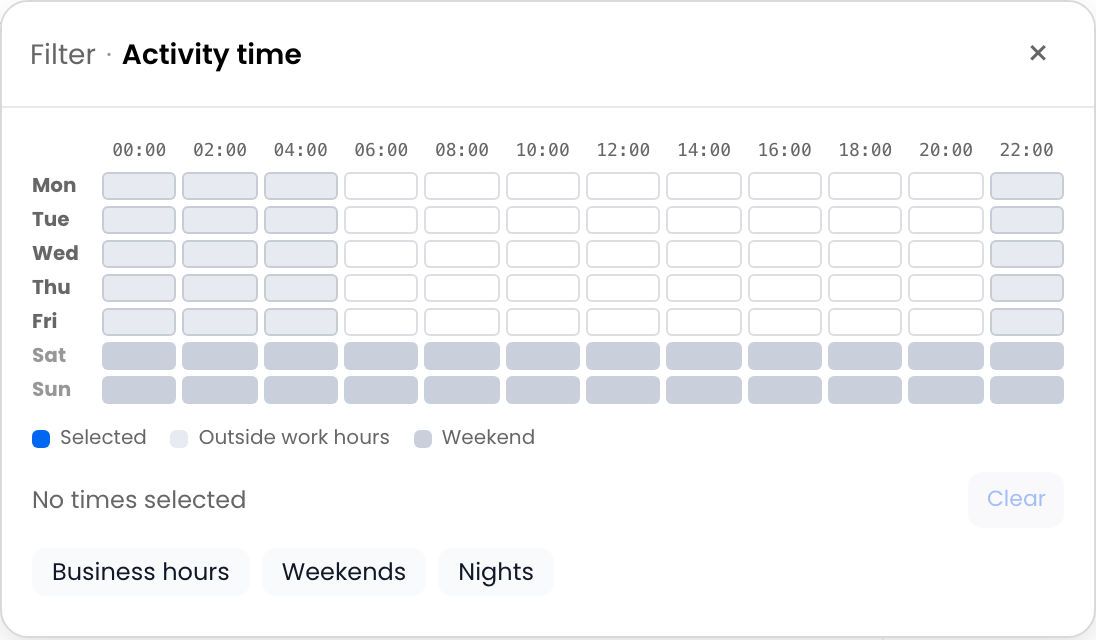
Use it when: the question is about recurring days and hours, not one absolute date range.
Example: find support incidents raised on weekdays between 18:00 and 22:00 in the selected timezone. Choose Relative Window for a rolling period or Timeline Brush for one-off temporal density.
Tri-state Boolean
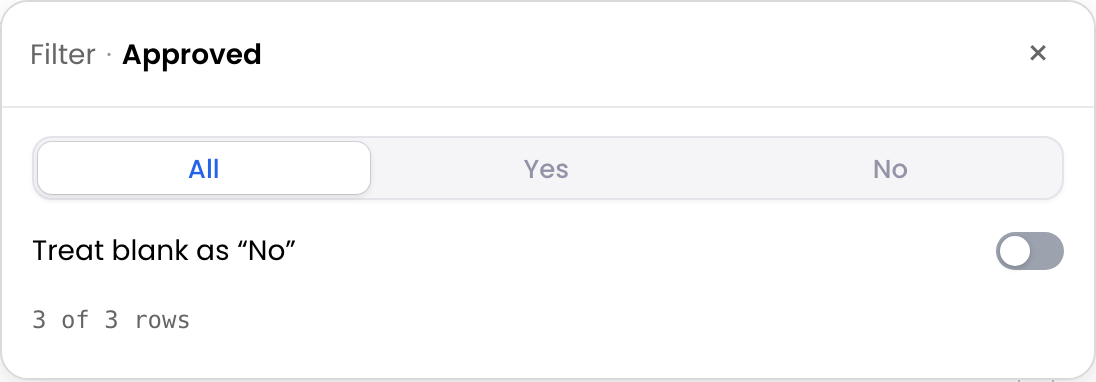
Use it when: users must distinguish an explicit false value from a missing value.
Example: show unapproved requests, optionally including records awaiting review. Choose Boolean when the source contract guarantees strict Yes/No data; Tri-state Boolean exposes the blank-data policy instead of hiding it.
Array and Tags

Use it when: cells contain multiple labels and the membership rule matters.
Example: find tickets tagged with both billing and priority, or products with none of the excluded compliance tags. Choose Array for empty/non-empty checks; Array/Tags is the purpose-built control for any, all, none, exact-set, and empty-list logic.
Workflows beyond one filter
The controls above create column conditions. These features make those conditions faster to use, easier to understand, reusable, or safe to execute on remote data.
| Workflow | Use it for |
|---|---|
| Inline header filters | Frequent operational filtering where the control should remain visible below the column name. |
| Active-filter badges | Keeping every active restriction visible after the popup closes. |
| Filter expressions | Power users entering several explicit conditions for one column. |
| Saved filter state | Reusable views such as High-value Europe, Review queue, or At-risk projects. |
| Canonical FilterAst | Nested AND, OR, and NOT logic across columns, transport, and reproducible server evaluation. |
| Custom filter operators | A domain rule that built-in operators cannot express correctly. |
| Server-side filtering | Large, paginated, protected, or governed datasets where the browser does not have the full population. |
Practical e-commerce and project-management views
E-commerce order operations
Start an agent with Quick Filter, then refine with Region Facets, Status Chips, a Total Slider or Histogram Brush, and a Relative Window for recent orders. Add filter badges and save High-value Europe as a shared view.
Product catalogs and inventory
Paste supplier SKUs into Token List, select categories from Faceted List, and brush a price distribution. Combine Stock < 10, Status is not Discontinued, and Array/Tags membership for a repeatable replenishment view.
Projects and portfolios
Use Chip Toggles for health, Rating/Progress Threshold for delivery state, and Relative Window for upcoming milestones. Statistical Presets answer “which projects are in the top risk decile?” without a manually maintained cutoff.
Support ticket queues
Use Quick Filter for a customer, error fragment, or ticket ID; Fuzzy Search for misspelled names; Regular Expression for incident-code audits; and Time Matrix for recurring after-hours demand.
Financial and operational reporting
Use Core Number conditions for policy thresholds, Calendar Range for fixed reporting periods, and Statistical Presets for exploration. For governed reports, serialize the FilterAst and its execution context to evaluate it against the complete backend dataset.
Start with the user’s question
Do not expose every filter on every column. A short status vocabulary deserves chips; a long vocabulary may need search and counts. A known financial cutoff needs a direct number condition; an exploratory decision may need a histogram. The best configuration gives each column the simplest trustworthy interaction for the decision a user needs to make.
For implementation details and working TypeScript, React, Vue, and Angular examples, continue with the Advanced Filtering showcase and its focused filter-type guides.