
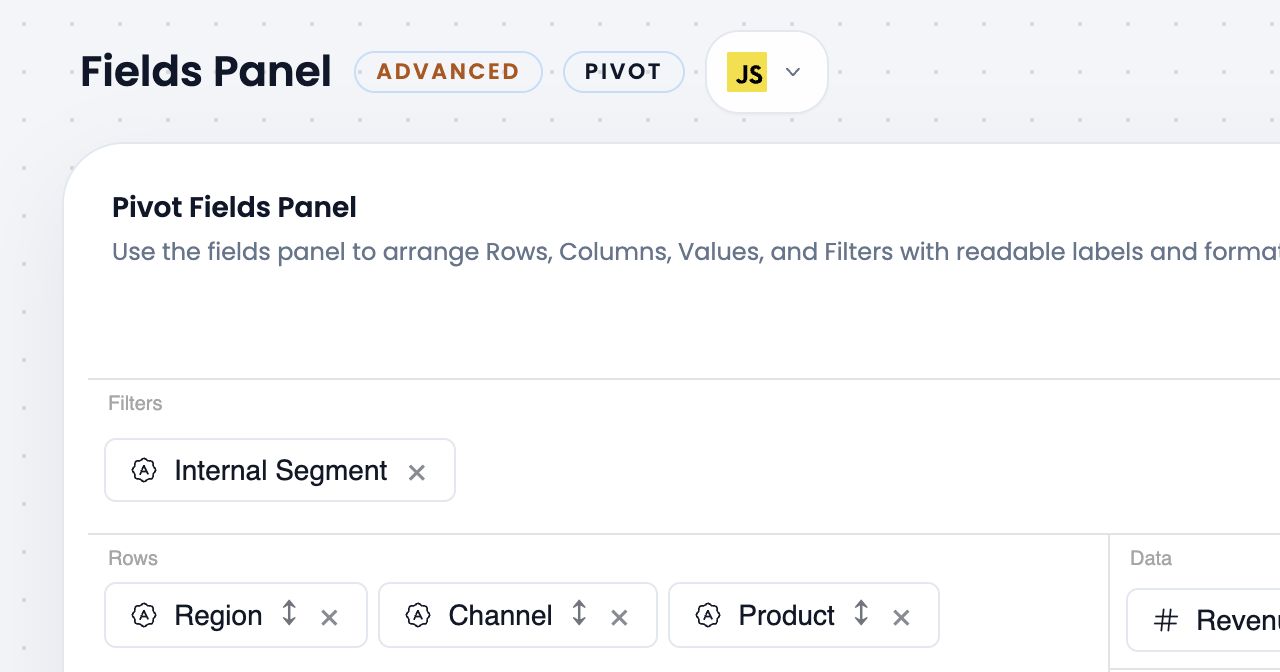
Drag-and-Drop Dimensions
Move fields between Rows, Columns, Data, and Filters slots at runtime. The pivot table updates instantly.
Try the Fields PanelFeature-rich JavaScript Pivot Table with linked charts. Group, filter, aggregate, visualize, drill into, and export large datasets without leaving the page.
Not a summary view bolted on top. A full-featured pivot engine built on RevoGrid's high-performance rendering core.
Move fields between Rows, Columns, Data, and Filters slots at runtime. The pivot table updates instantly.
Try the Fields Panel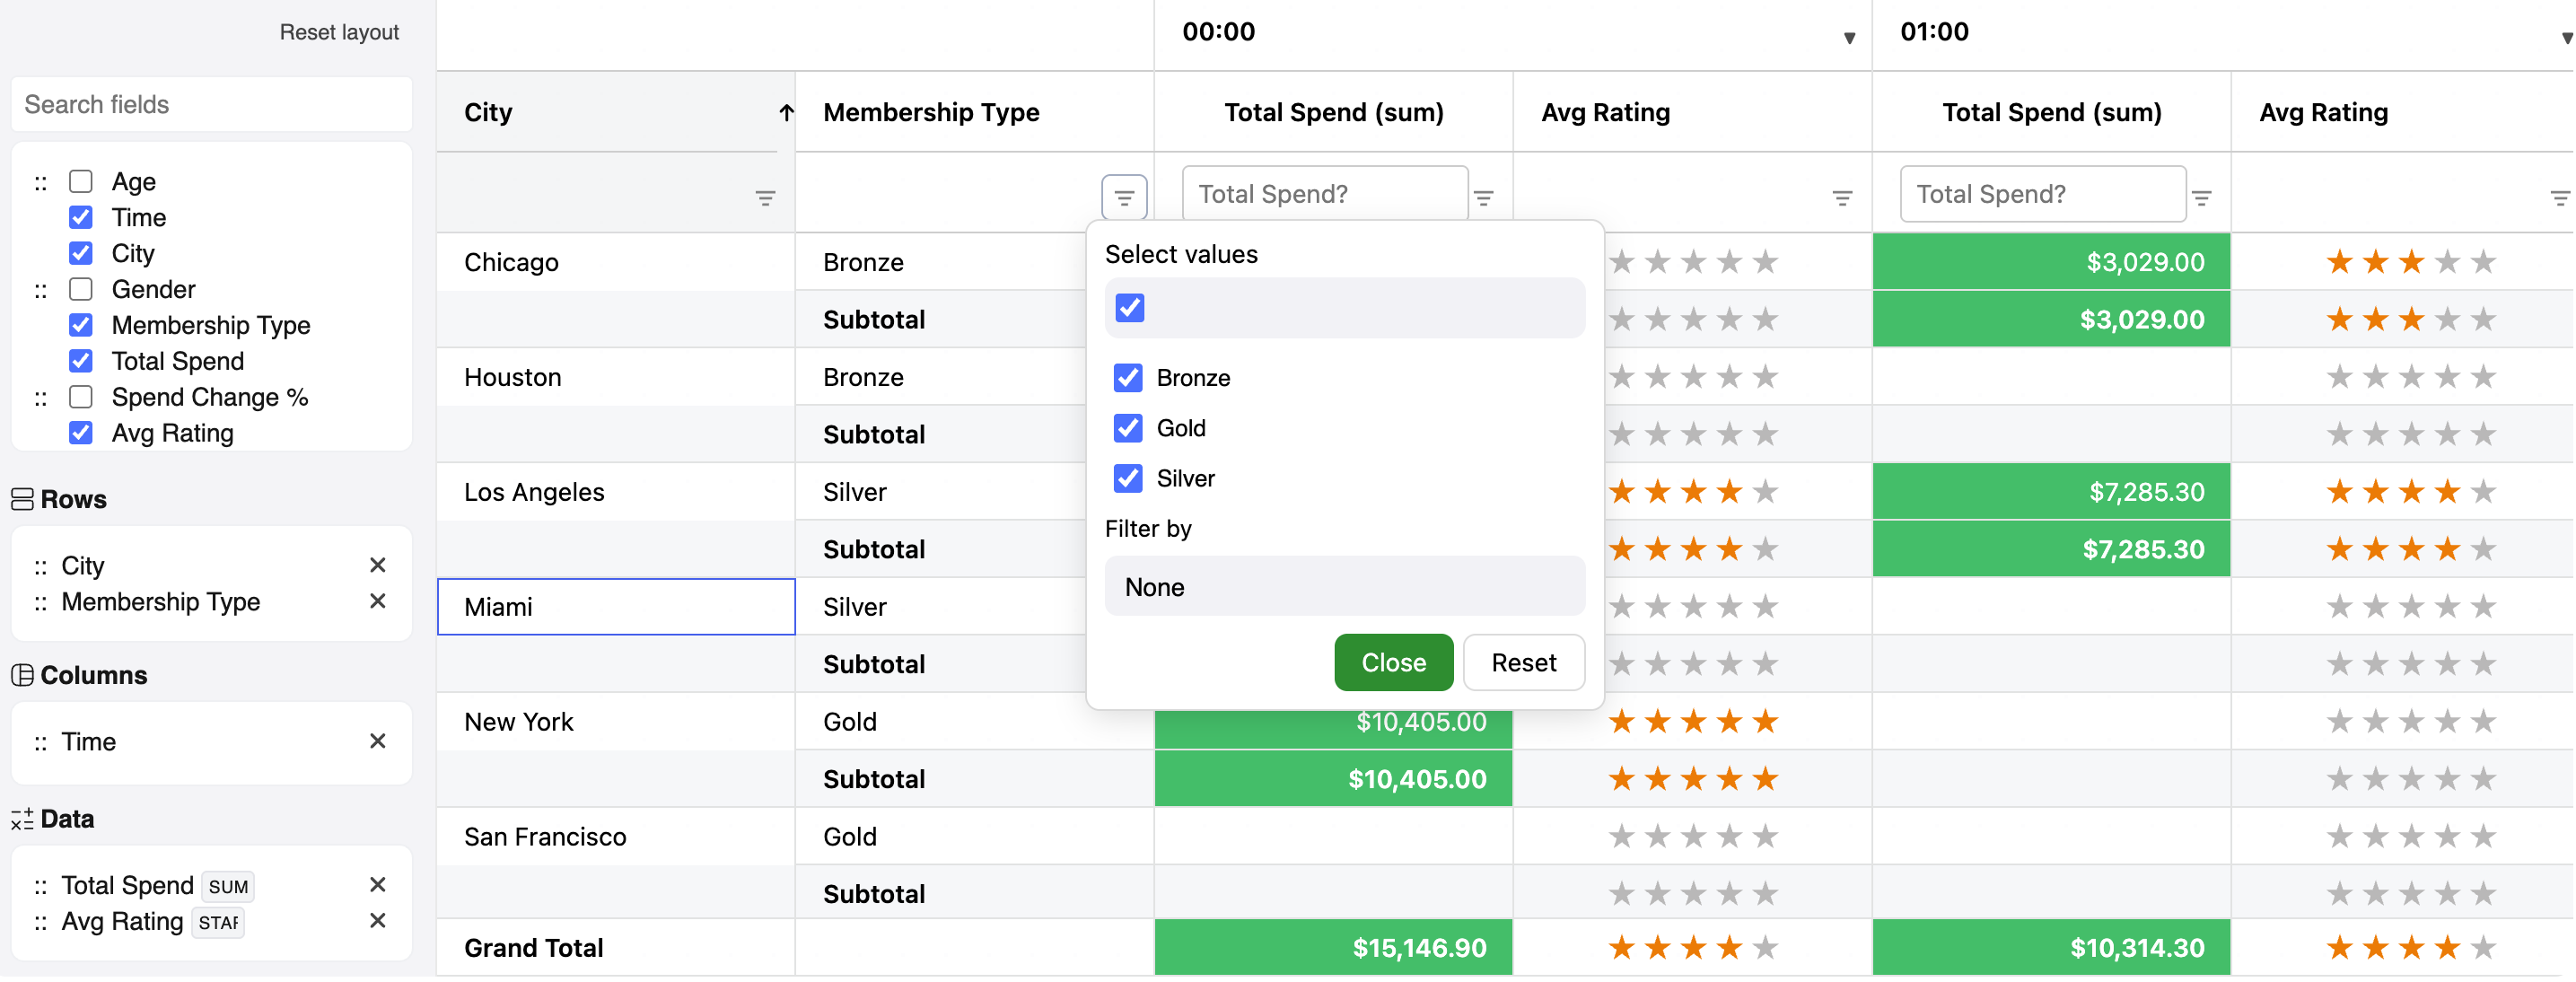
Sum, average, count, min/max, median, or bring your own aggregation function. Use multiple aggregations on the same field.
Open the Pivot workspace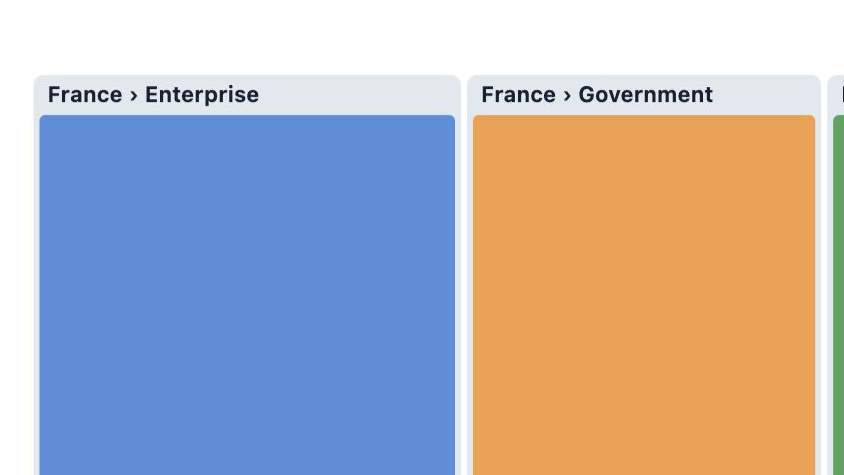
Create interactive column, line, area, pie, and other charts from the active Pivot result. Charts stay linked as fields, filters, and drill state change, while heatmap cells highlight trends and outliers in the grid.
Create a linked chart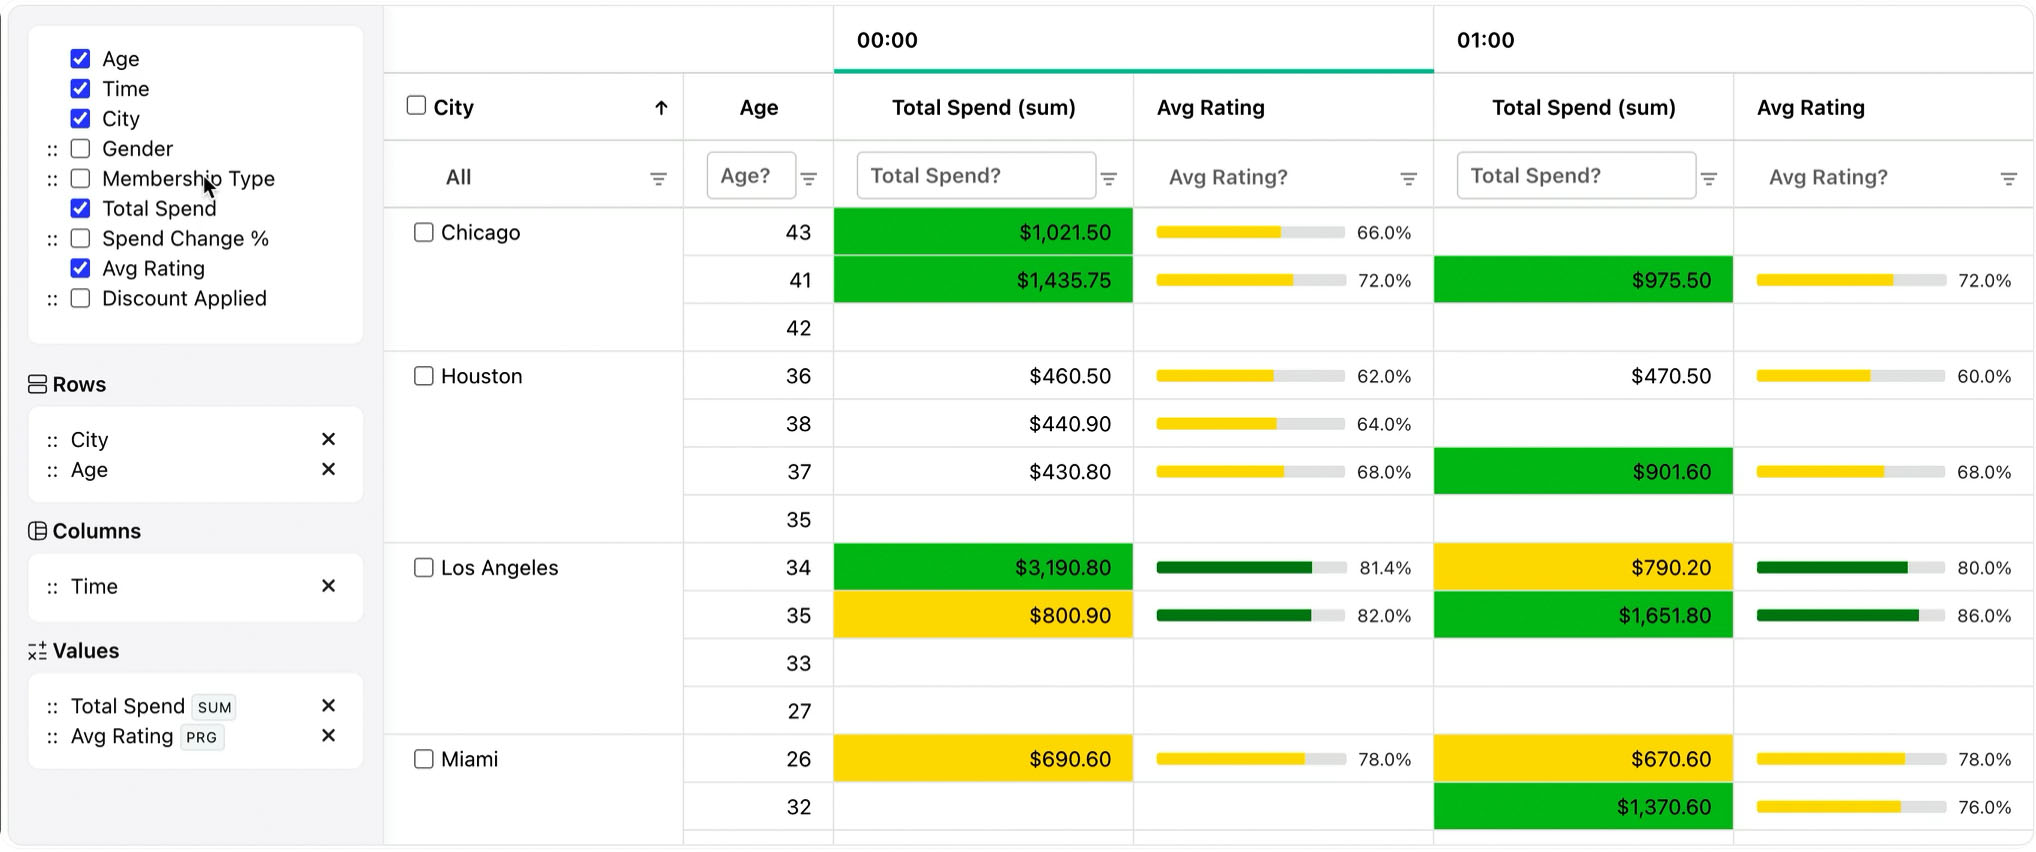
Drag any dimension field to Rows or Columns. Subtotals and grand totals are computed automatically at every group level.
Explore Pivot grouping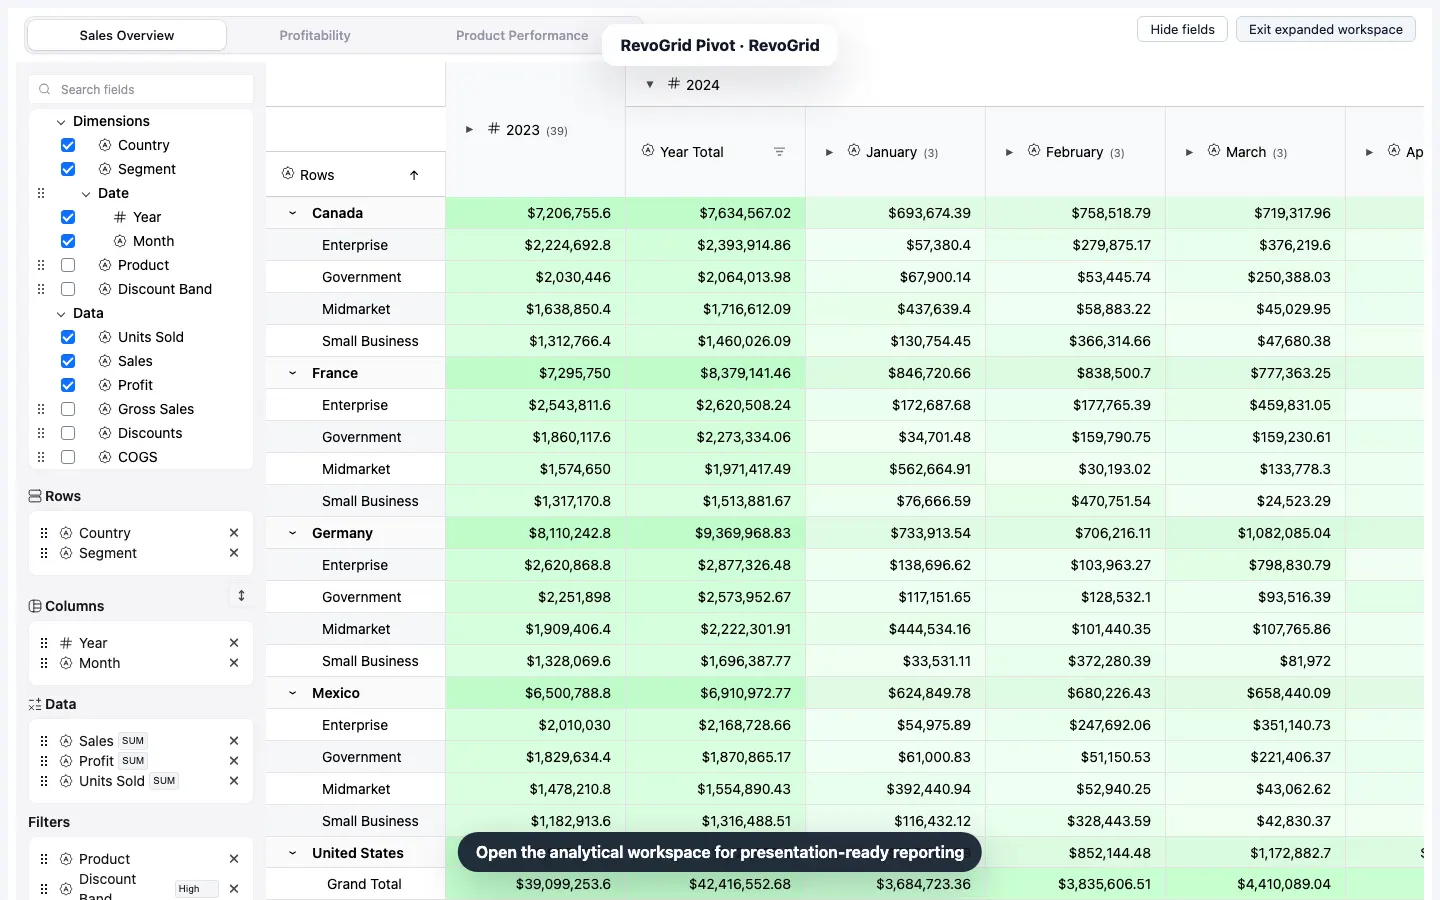
No server round-trip on pivot operations. Bind the pivot config directly and run aggregations against the grid source.
Test the full Pivot demo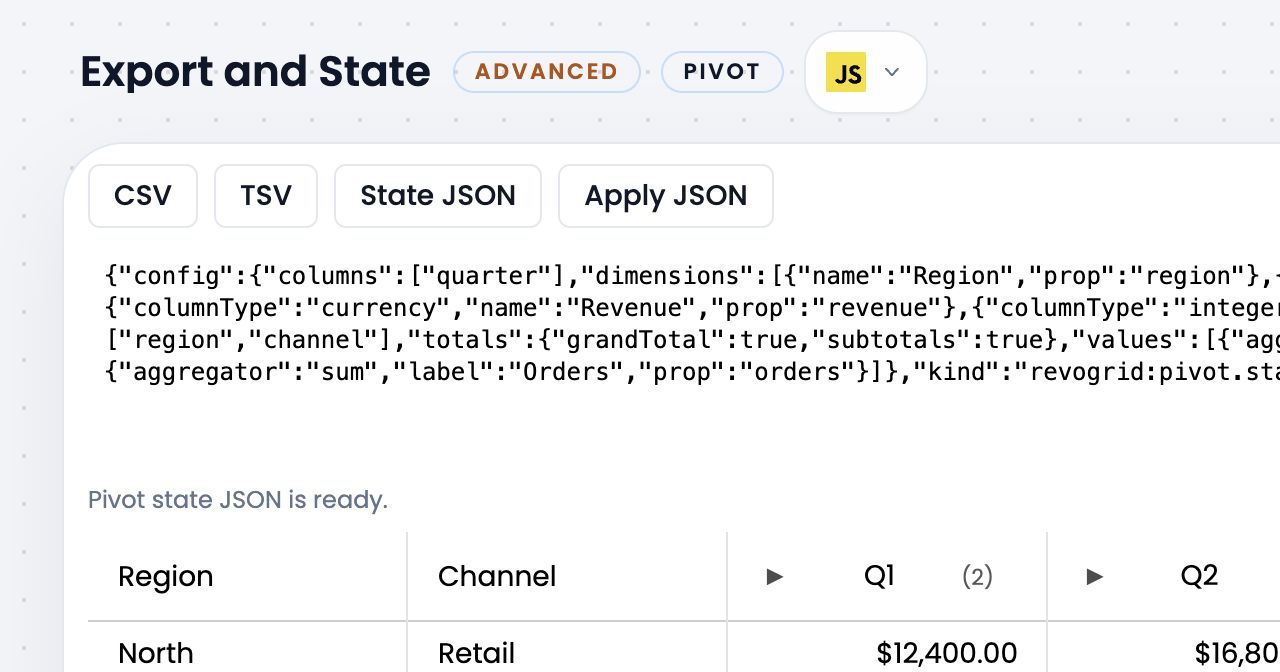
Export the visible Pivot result to CSV or TSV, and round-trip the active analytical layout as versioned state JSON.
Try export and stateRevoGrid Pivot ships with linked charts for BI dashboards, analytics products, financial reporting tools, and data-heavy internal apps.
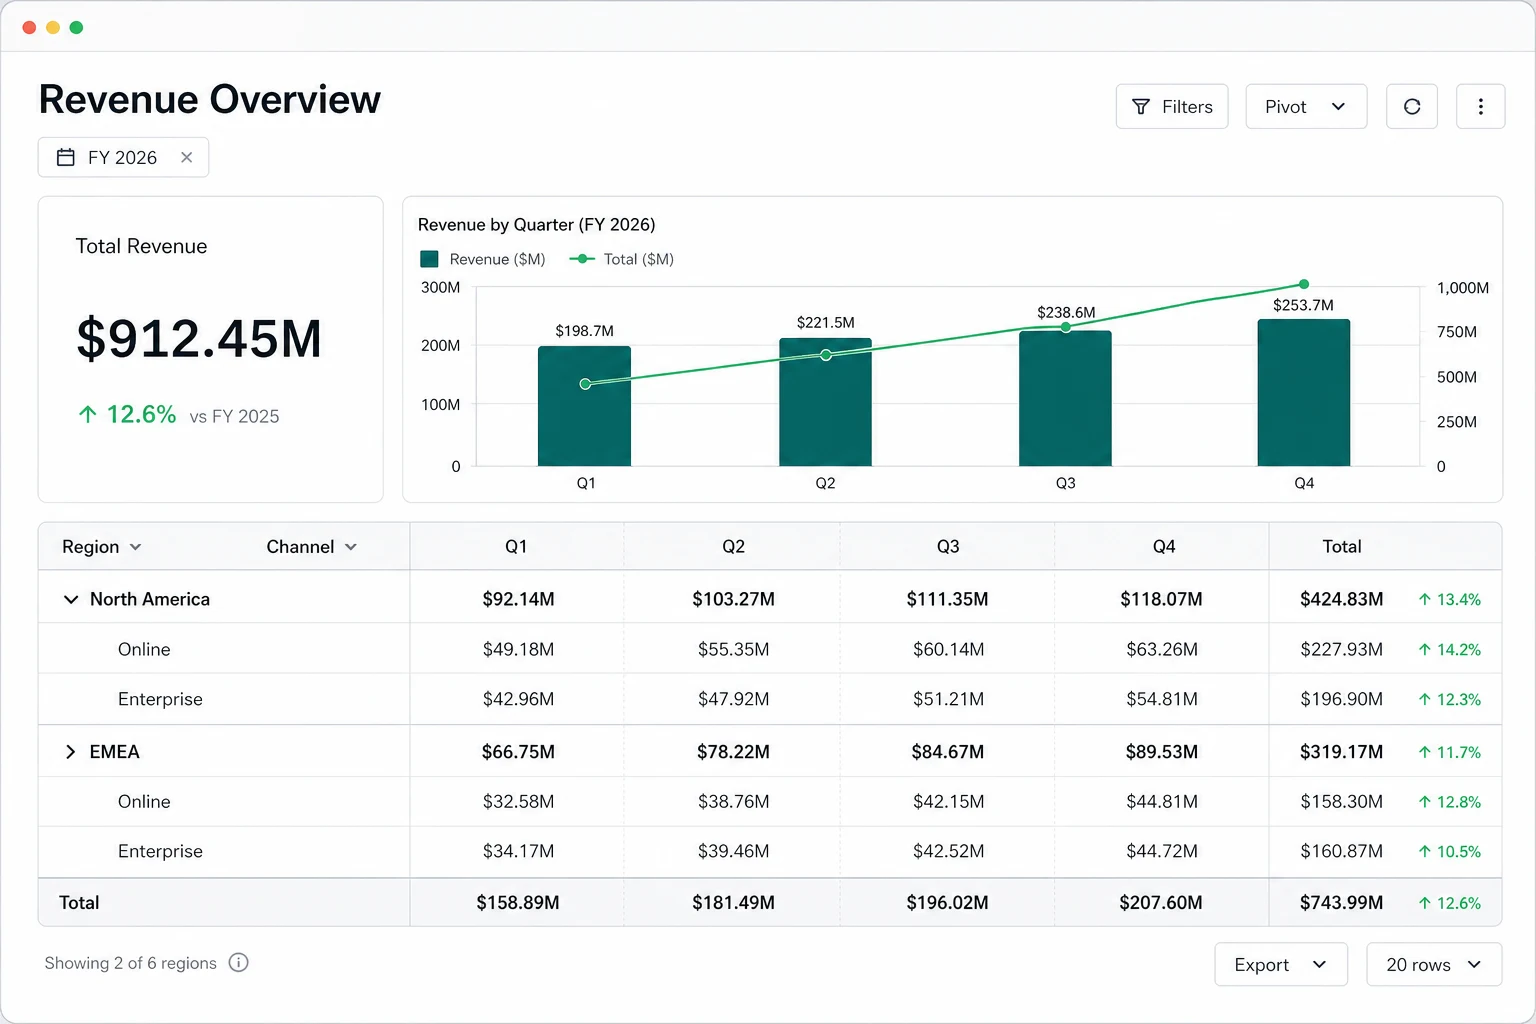
Turn raw sales records into an interactive revenue view by region, channel, and quarter. Teams can expand a market, compare its channels, and see linked chart updates without building a separate reporting workflow.
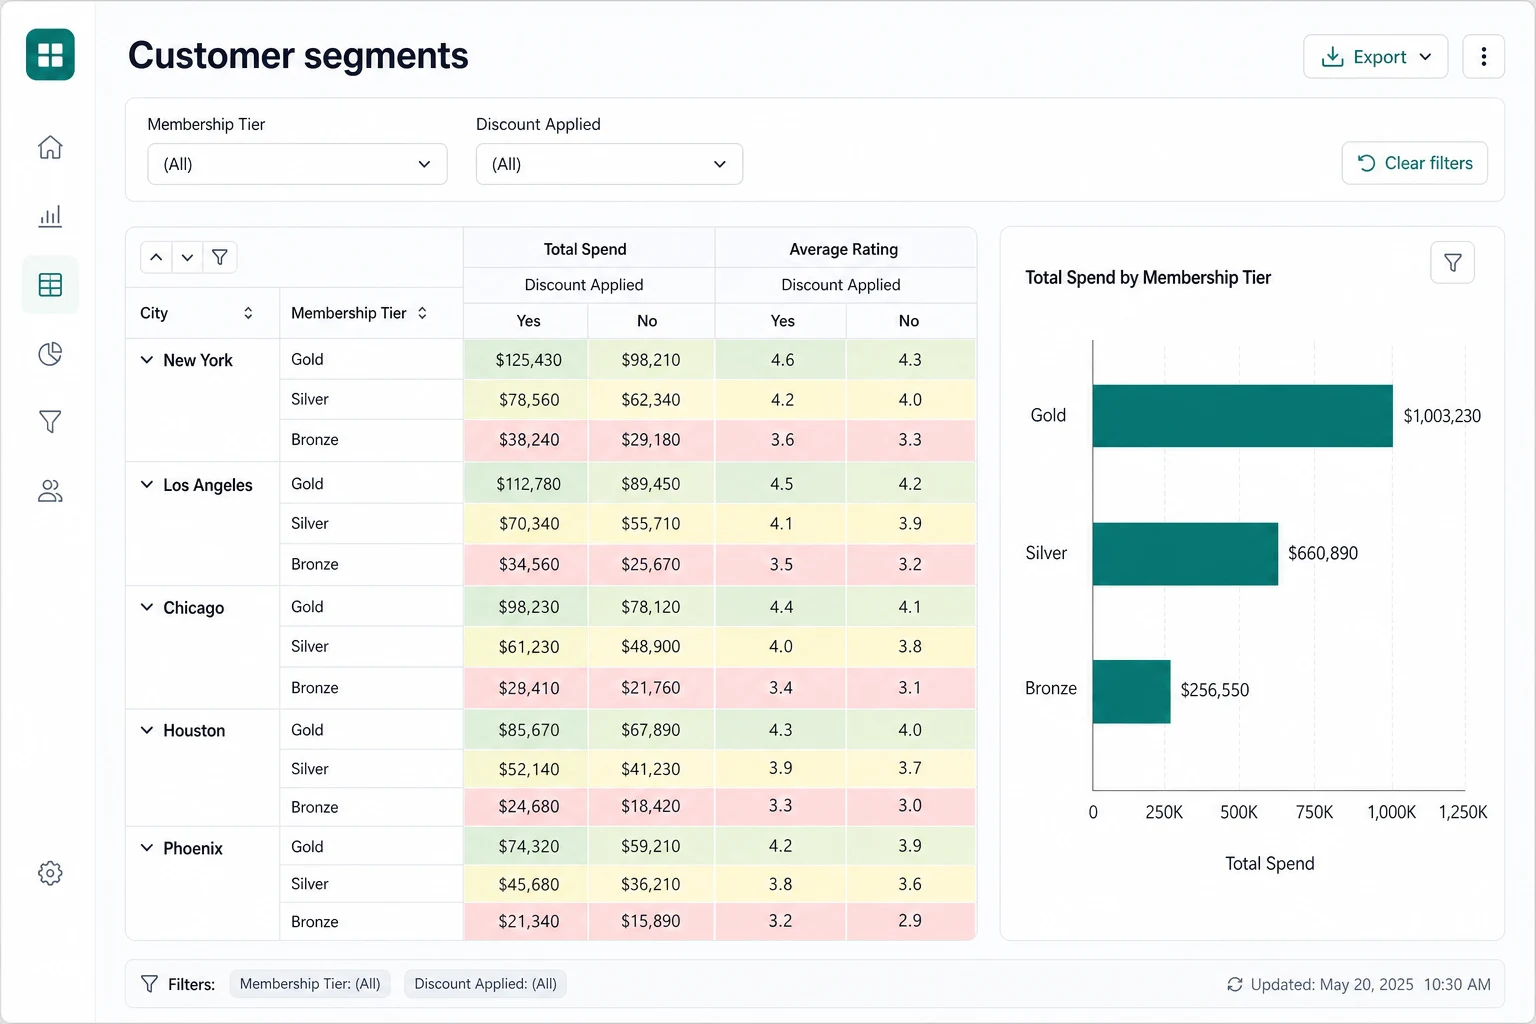
Turn customer behavior into clear, actionable segments. Compare spend, ratings, membership tiers, cities, and discount usage in one interactive pivot, then follow patterns instantly through linked charts and heatmapped values.
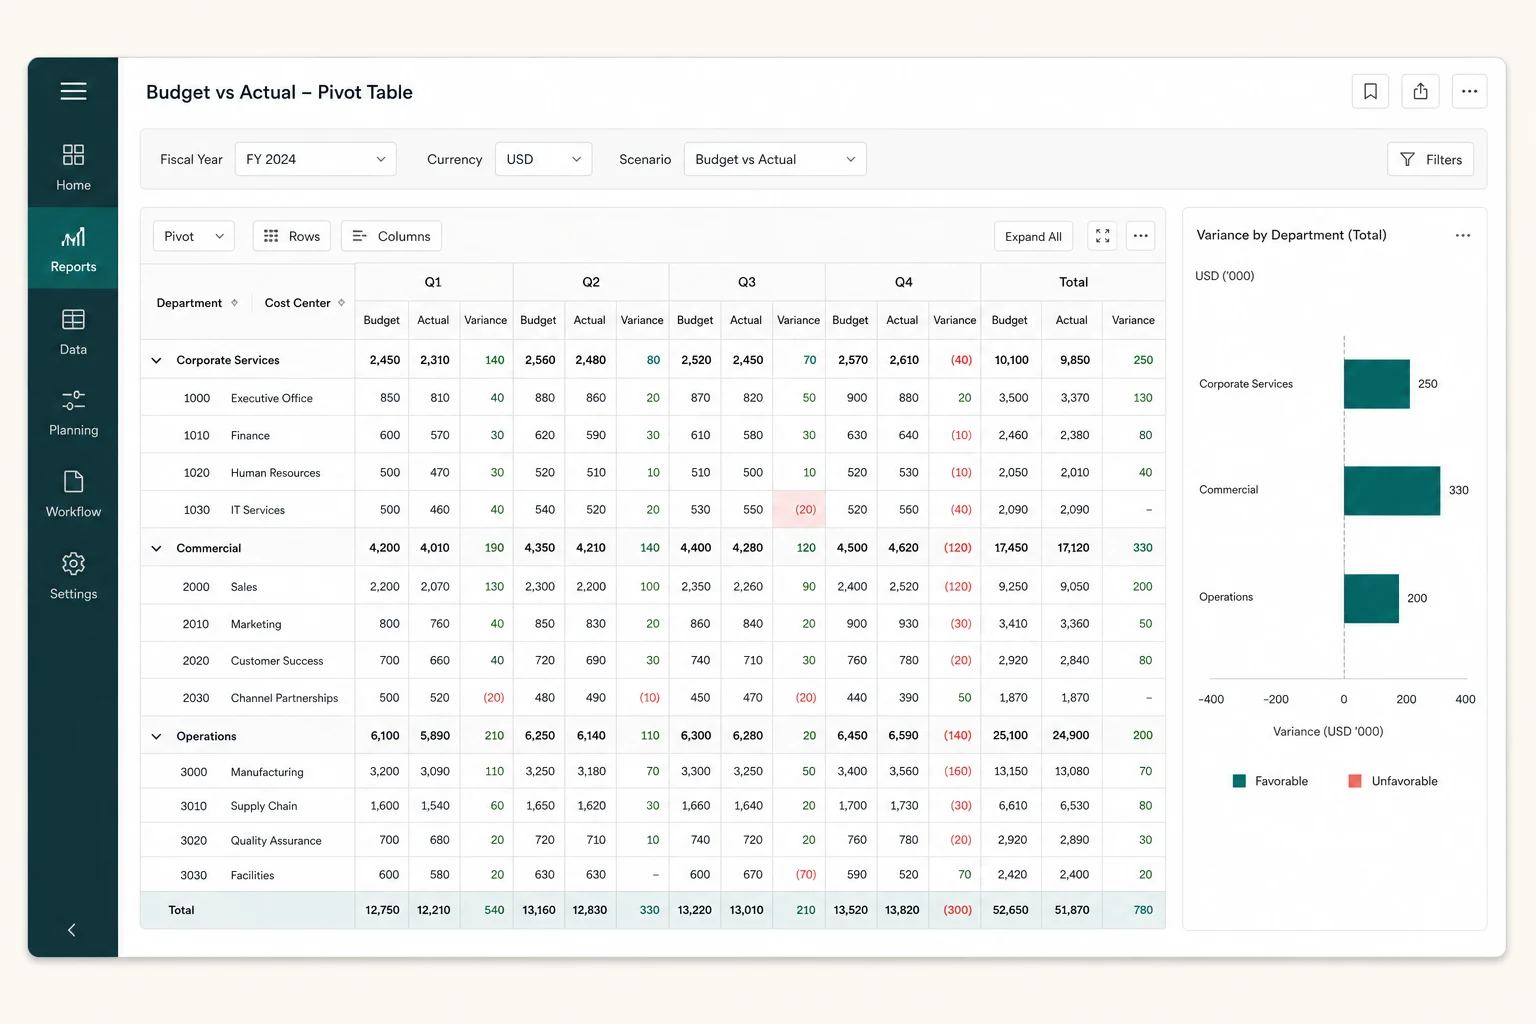
Turn live finance data into board-ready P&L, cost-center, and budget-versus-actual views. Teams can drill from consolidated totals into departmental variances while filters, subtotals, and linked charts remain synchronized inside their application.
RevoGrid Pivot is included with Pro Advanced, together with original private source access, unlimited product usage, and priority support.
FAQ
Add embedded pivot analytics to your application. Included in Pro Advanced.